Update Date: August - 2024
Carlos Alegria, Yuri Nunes
Link to Pre-print paper: Paper Link
Other components of Liver Disease Deaths report:
Navigation to related reports:
US - Trends in death rates from Neoplasms, Ages 15-44
US - Trends in death rates from Neoplasms for all ages and detailed analysis of 75-84
US - Estimating Covid-19 over-reporting as underlying cause of death.
US - Trends in death rates from Neurological Diseases for all ages and detailed analysis of 15-44.
US - Trends in death rates from Acute Renal Failure (N17) for all ages and detailed analysis of 35-44.
US - Trends in death rates from Musculoskeletal Diseases (M00-M99) for all ages and detailed analysis of 75-84.
In this section we analyse the trend in yearly death rates from Liver Diseases for individuals aged 35 to 44 in the USA. We use the 2013-2019 trend in deaths per 100,000 (death rates) as the baseline estimate for excess death rates. Excess death rates for the 2013-2019 period are in-sample while the rates for 2020, 2021, 2022 and 2023 are out of sample computations.
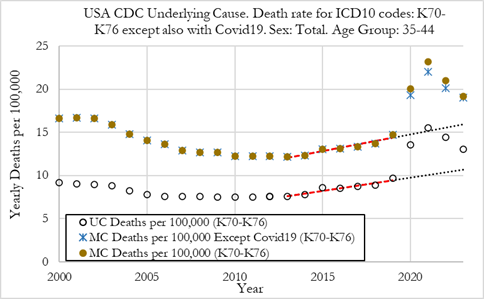
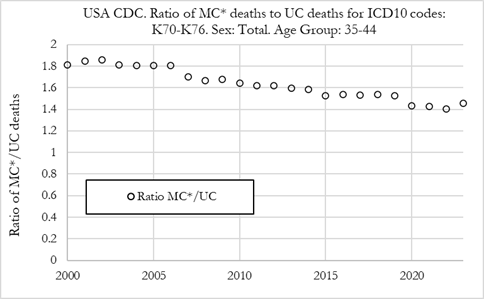
The Figure (left) below shows the death rate per 100,000 individuals from Liver Disease deaths (ICD-10 codes K70-K76) in the US, for the 35-44 age group of both sexes, for the period of 2000 to 2023. The Figure plots death rates as underlying cause of death (UC) and reported as multiple-cause (MC) of death, as well as MC* death rates (where COVID-19-related deaths are removed from MC death counts). The Figure on the right shows the ratio of MC deahts by UC deaths.
Summary:
The Figure (left) shows the death rate per 100,000 individuals for deaths from liver disease from 2000 to 2023, for individuals aged 35-44. We can observe that both UC and MC death rates from liver disease have been trending higher from 2013 to 2019.
Both MC and UC death rates from liver disease trended lower from 2000 to 2013 and thereafter trended upwards from 2013 to 2019. MC deaths rates were 12.14 per 100,000 and in 2013, rising to 14.75 per 100,000 in 2019, a 21% increase (which corresponds to a 3.1% rise per annum). As for UC deaths, in 2013 the death rate was 7.60 per 100,000 and in 2019 it was 9.66 per 100,000, a 27.1% decline (which corresponds to a 3.9% rise per annum).
We also observe in the Figure (right) that the ratio of MC to UC deaths were on a stable downward trend from 2000 to 2019, from a value of 1.8 in 2000 to 1.55 in 2019, which is slightly lower than the equivalent ratio for individuals aged 75-84.
The MC death rate was 14.75 per 100,000 in 2019 and then rose in 2020 to 20.05 per 100,000, and then to 23.22 per 100,000 in 2021. In 2022 death rates dropped to 20.99 per 100,000 and then to 19.20 per 100,000 in 2023.
MC* death rates (after removing COVID-19-related deaths) rose in 2020 to 19.33 per 100,000, and then to 22.02 per 100,000 in 2021. In 2022, death rates were 20.15 per 100,000 and 19.20 per 100,000 in 2023. Removing COVID-19 related deaths, does not have a significant impact on MC death rates.
As for UC death rates, these jumped from 9.66 per 100,000 in 2019 to 13.53 per 100,000 in 2020 and then to 15.53 per 100,000 in 2021. In 2022 the UC death rate was 14.4 per 100,000 and in 2023 it was 13.04 per 100,000.
The ratio of MC* to UC deaths remained stable in 2020, 2021, 2022 and 2023, after a slight drop in 2020.
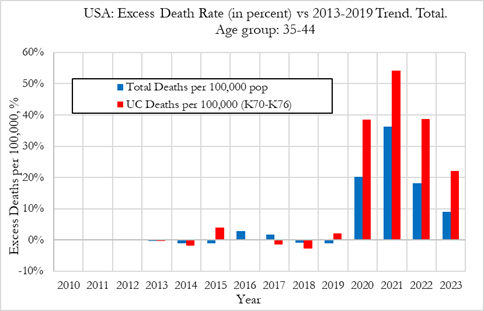
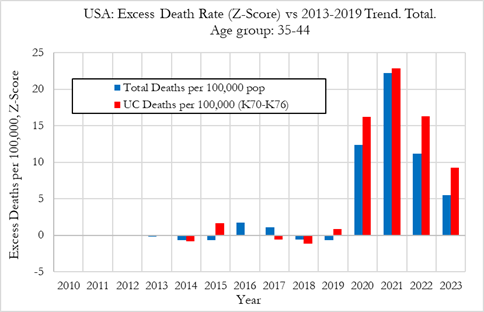
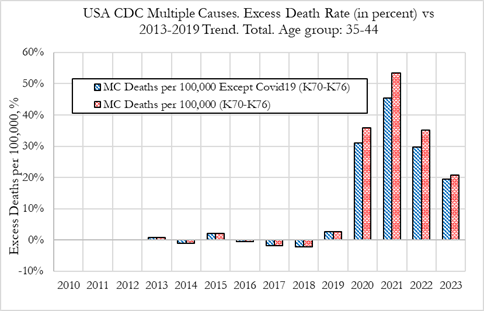
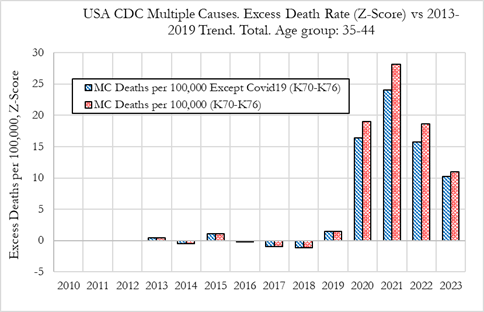
In this section we investigate excess death rates from Liver Diseases in the US, for the 35 to 44 age group from 2010 to 2023. The figure on the left refers to relative deviations from the 2013-2019 trend, while the figure on the right shows the Z-score (signal strength) for the deviations from trend.
The figure below shows the excess death rate from liver disease in the US (icd10 codes: K70-K76), for the 35 to 44 age group from 2010 to 2023. The plots also show the excess all-cause deaths for comparison. The figure on the left refers to relative deviations from the 2013-2019 trend, while the figure on the right shows the Z-score (signal strength) for the deviations from trend.
Summary:
We now analyse excess MC deaths rates and excess MC* death rates (by excluding COVID-19 related deaths) from liver disease (icd10 codes: K70-K76), for ages 35 to 44 in the US, as shown in the figure below. The figure on the left refers to relative deviations from the 2013-2019 trend, while figure on the right shows the Z-score (signal strength) for the deviations from trend.
Summary:
Other components of Liver Disease Deaths report:
